Inside a Spring Boot Request — Threads, Security, Transactions & System Limits Explained
A developer-friendly reference covering the full Spring Boot request lifecycle. From client TCP connection to Tomcat thread handling, security filter chain, DispatcherServlet routing, controller-service-repository flow, transactional management, database connection pooling, and JSON response serialization. Includes thread isolation, bottlenecks, and performance considerations—ideal for debugging, tuning, and understanding internal mechanics quickly.
Shreyash Gurav
March 15, 2026
20 min read
Inside a Spring Boot Request — Threads, Security, Transactions, Memory, and System Limits
Most developers interact with Spring Boot at the surface level: write a controller, add a service, annotate a method with @Transactional, and ship it. But understanding what happens inside the application from the moment a request arrives to the moment a response is sent back is what separates a developer who writes code from an engineer who understands systems.
This article walks through the complete internal lifecycle of a Spring Boot HTTP request. It covers how threads are assigned, how security context is established, how transactions bind to the request, how database connections are managed, and where your application breaks under load. Every section describes behavior that is actually happening inside your JVM right now — most of it invisible unless you know where to look.
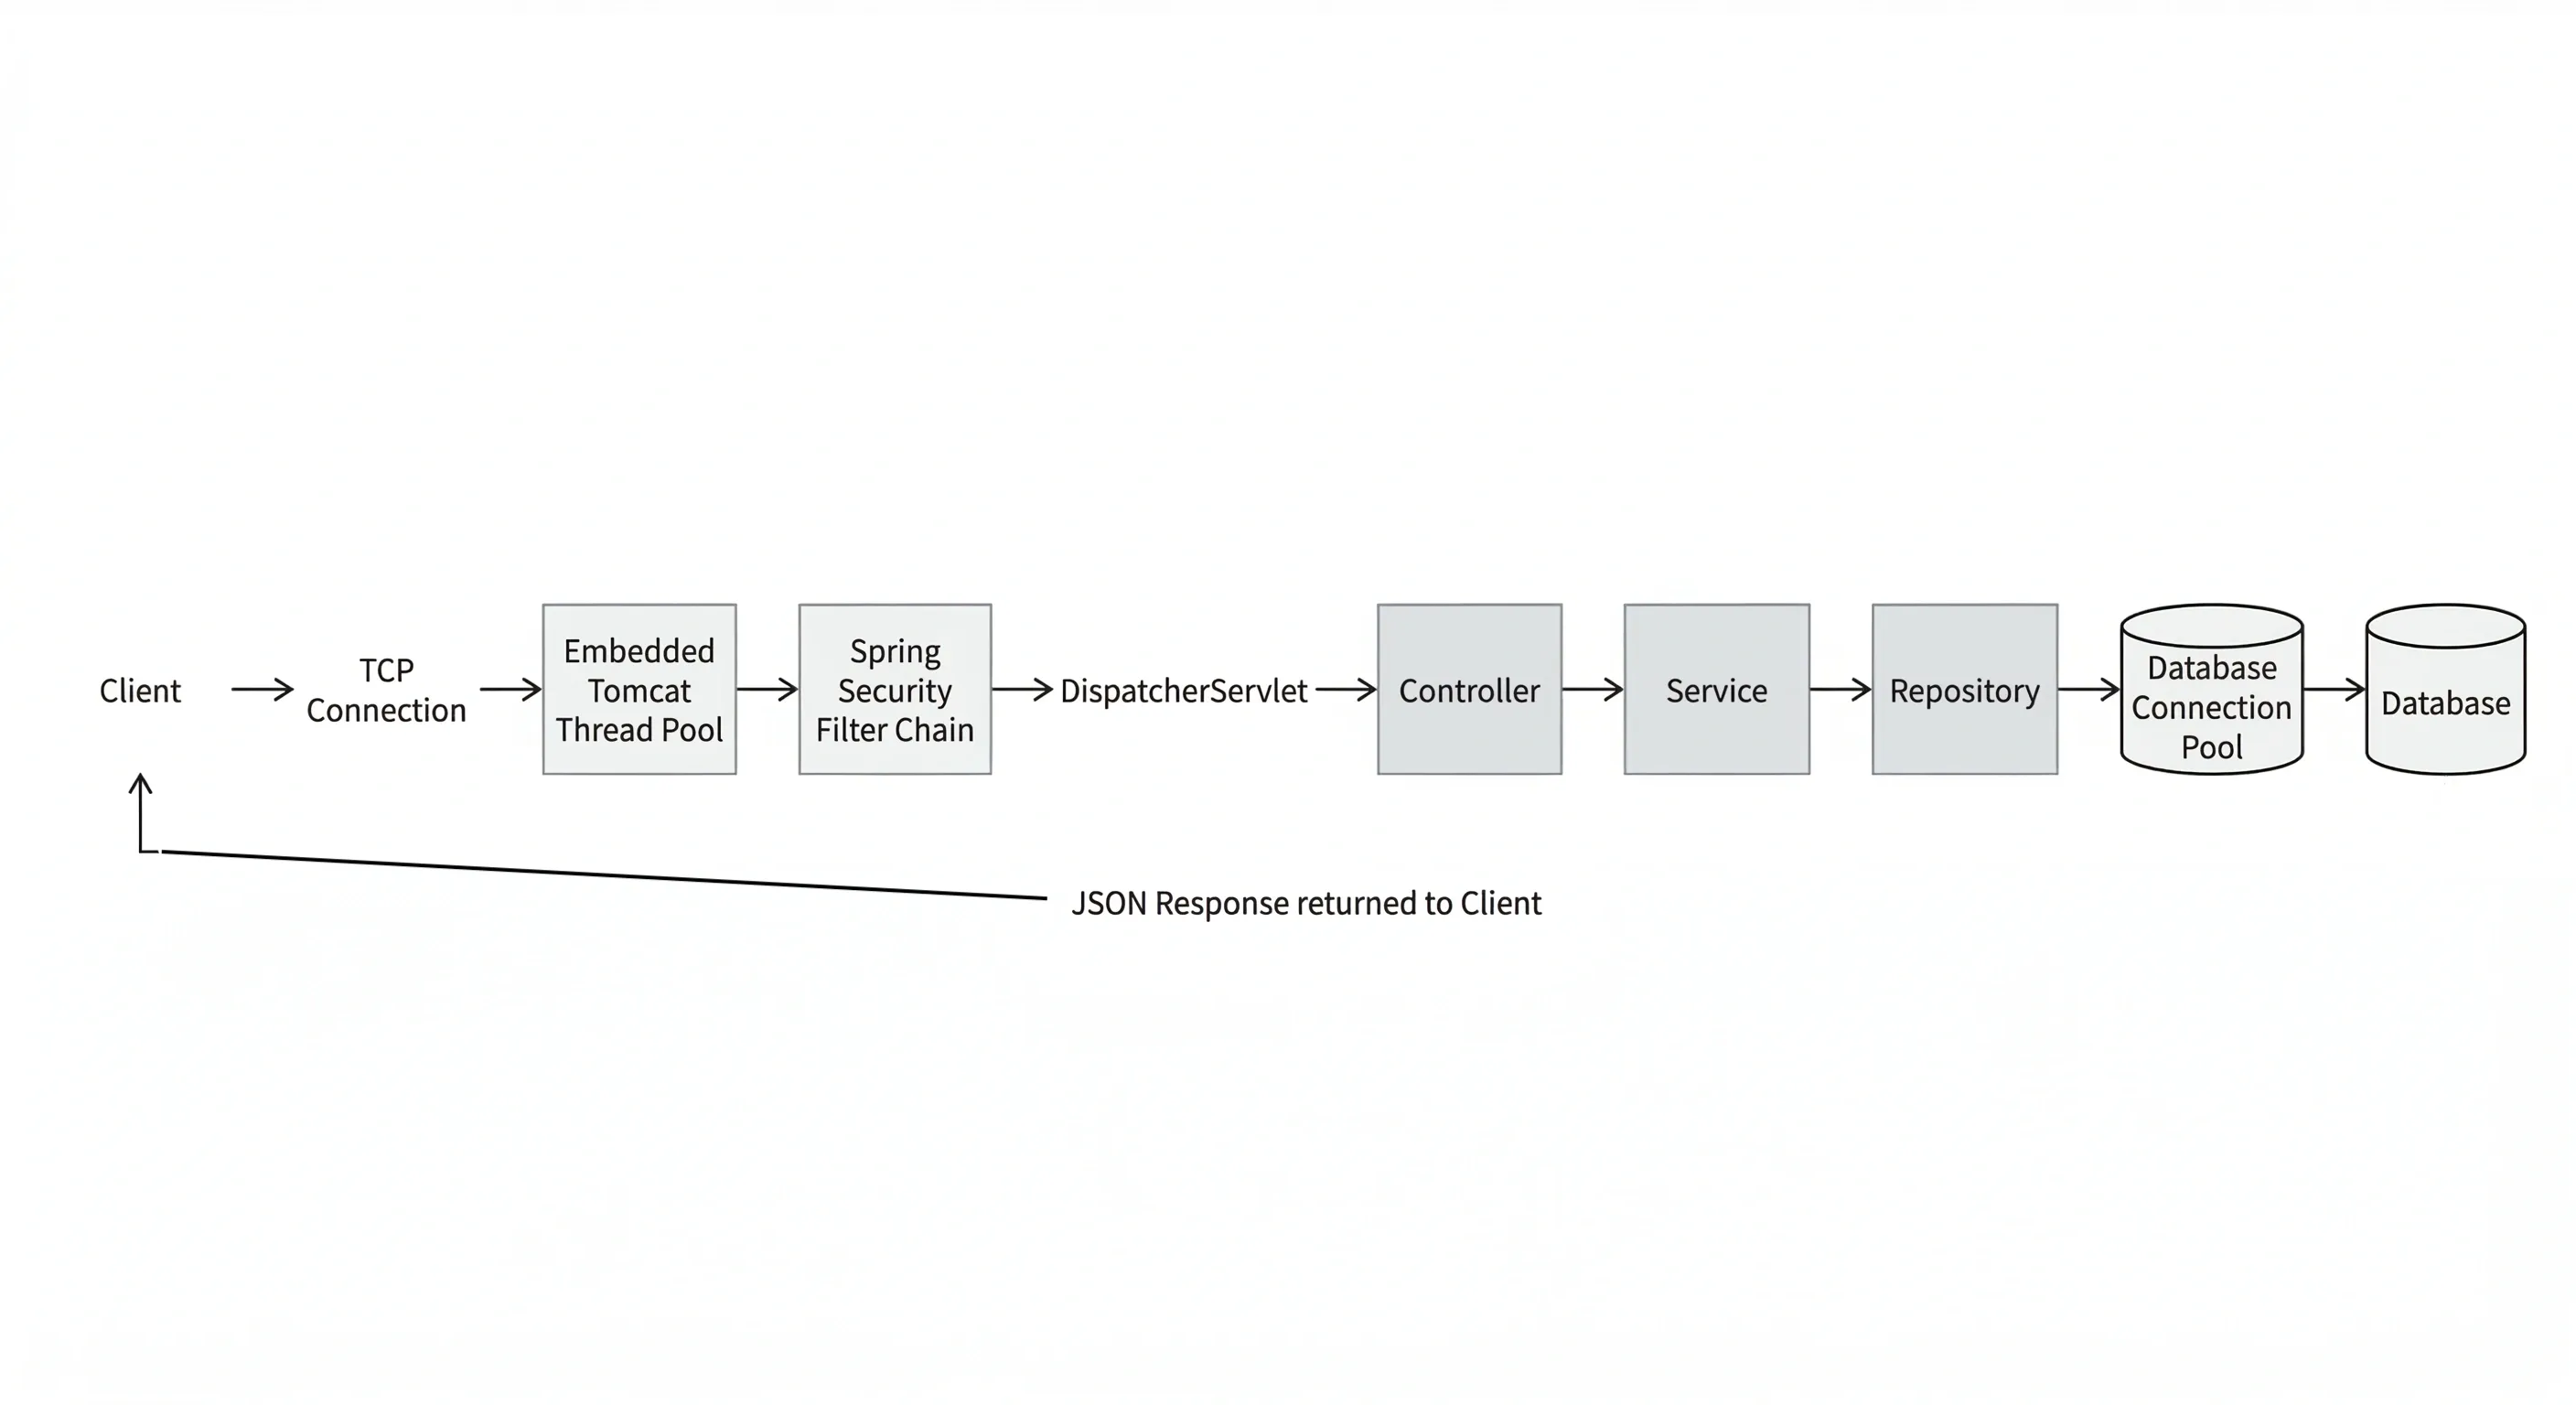
Overview — The Complete Request Journey#
When a client sends an HTTP request to a Spring Boot application, it enters a well-defined pipeline. Each stage has a specific role. Nothing happens randomly.
At the highest level, the journey looks like this:
- The client sends a TCP connection and HTTP request to the embedded server (Tomcat by default).
- The server accepts the connection and assigns a worker thread from its thread pool.
- The request passes through the Servlet filter chain, which includes Spring Security filters.
- The authenticated request reaches
DispatcherServlet, which routes it to the correct controller method. - The controller delegates work to a service, which may open a database transaction and interact with a repository.
- A database connection is borrowed from the connection pool, queries are executed, and the connection is returned.
- The response is serialized (usually to JSON) and written back over the TCP connection.
- The thread is released back to the pool, ready for the next request.
Every single one of these steps has performance implications, memory implications, and failure modes. Let us go through each one carefully.
Request Entry and Thread Assignment#
What is a Thread#
A thread is the smallest unit of execution in a Java process. When your Spring Boot application starts, it runs inside a single JVM process. That process can run many threads concurrently, each with its own execution stack, meaning each thread tracks its own method calls, local variables, and program counter independently.
Threads share heap memory, which is where objects live. But each thread has private stack memory, which is where its method call frames live. This distinction matters because it is exactly how Spring Boot isolates request state.
How the Server Assigns a Thread#
Spring Boot ships with an embedded Tomcat server by default. When Tomcat starts, it creates a pool of worker threads. This pool sits idle, waiting for incoming connections.
When a new HTTP request arrives, Tomcat accepts the TCP connection on the acceptor thread, then hands the actual request processing off to a worker thread from the pool. From that moment forward, the entire lifecycle of that request — filters, controllers, services, database calls — happens on that one worker thread unless you explicitly change that.
This is called the thread-per-request model. It is the default behavior in Spring MVC.
The thread is occupied for the full duration of the request. If your method blocks on a database query for 200ms, the thread is held for those 200ms and cannot serve any other request during that time.
Async and Reactive Exceptions#
If you introduce @Async, CompletableFuture, or Spring WebFlux, work may move to a different thread mid-request. When that happens, critical pieces of thread-local state — specifically the SecurityContextHolder and any active transaction — do not automatically follow. They are bound to the original thread and become invisible on the new thread.
You must explicitly propagate state when crossing thread boundaries. Spring provides DelegatingSecurityContextRunnable and DelegatingSecurityContextCallable for this. In WebFlux, use ReactiveSecurityContextHolder.
Thread Pool and Request Concurrency#
How the Thread Pool Works#
Tomcat maintains a bounded thread pool. By default, it allows up to 200 worker threads. When a request arrives, a free thread is taken from the pool and assigned to that request. When the request finishes, the thread is returned to the pool and becomes available again.
You can tune this in application.properties:
threads.max defines the maximum number of concurrent requests being actively processed. accept-count defines how many requests can be queued waiting for a thread when the pool is full.
Concurrent Request Processing#
Two requests arriving at the same millisecond are handled on two separate threads simultaneously. They may be executing code in the same service class and the same repository class at the same time, but each has its own stack, its own local variables, and its own thread-local state. This is how Spring achieves request isolation without any locking overhead in the typical case.
These two requests run in complete isolation from each other, even though they are executing the same code paths.
What Happens When the Pool is Full#
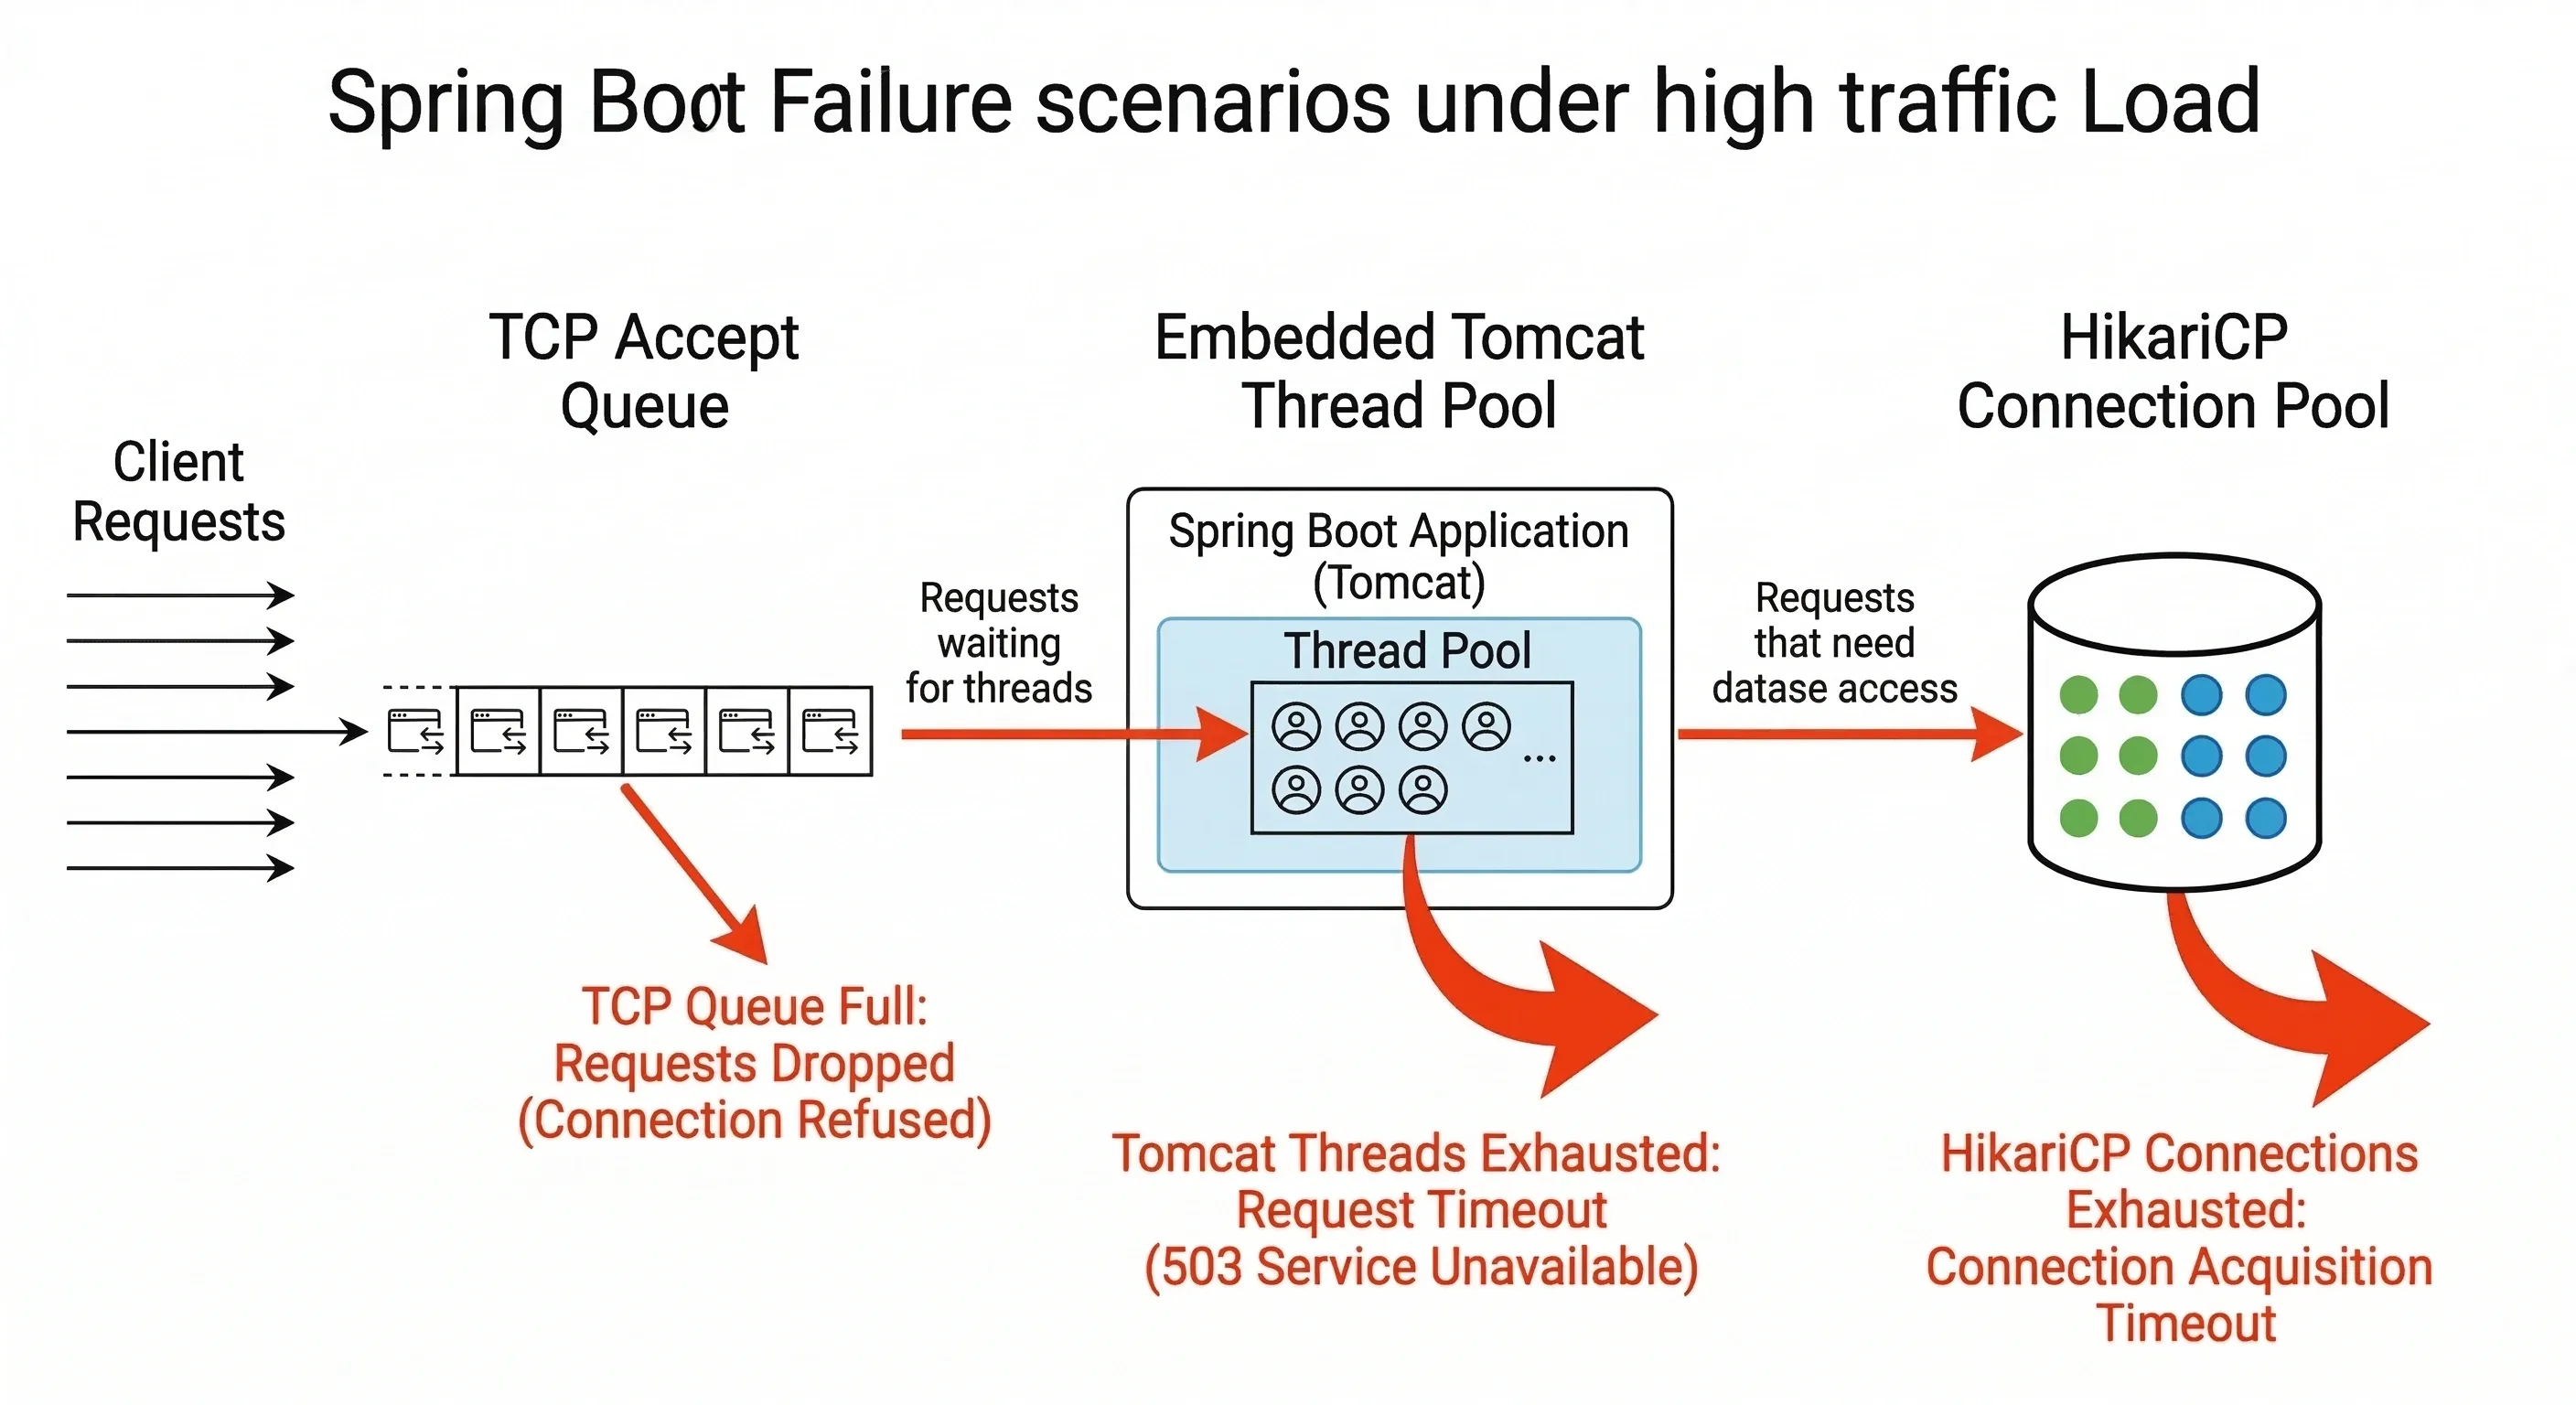
When all 200 threads are occupied with in-progress requests, new incoming requests do not get rejected immediately. They are placed in a TCP accept queue (bounded by accept-count). If that queue also fills up, the server stops accepting new TCP connections, and clients will see a connection timeout or connection refused error.
This is the first hard throughput ceiling your application has.
Memory Usage of Request Threads#
Thread Stack Size#
Each thread has a dedicated stack allocated from JVM memory. In most JVMs, the default thread stack size is 512KB to 1MB. With 200 threads, that alone accounts for 100MB to 200MB of memory reserved for thread stacks, independent of heap usage.
You can tune stack size with the -Xss JVM flag:
Reducing stack size allows more threads to exist within the same memory footprint, but too small a stack causes StackOverflowError for deeply recursive code.
Request and Response Objects#
Every HTTP request creates a HttpServletRequest object on the heap. It holds the request headers, query parameters, path variables, and request body. The response object (HttpServletResponse) holds the response buffer. For large request bodies or file uploads, these objects can consume significant heap memory.
Spring also creates objects throughout the chain: filter instances (shared, not per-request), the Authentication object in the security context, the @Transactional proxy interceptor call frames, repository proxies, and finally the response DTO serialized to JSON.
All of these are garbage collected after the request completes, but during the request they all live on the heap. High-traffic applications can generate significant GC pressure if response objects are large or if many requests are running concurrently.
Security Processing and User Isolation#
The Filter Chain#
Before a request ever reaches DispatcherServlet, it passes through the Servlet filter chain. Spring Security registers itself as a filter in this chain, specifically through FilterChainProxy. This proxy delegates to a series of security filters, each with a specific responsibility.
The most important for most applications is UsernamePasswordAuthenticationFilter or, in stateless APIs, a custom JWT authentication filter. This filter extracts the credentials or token from the request, validates them, and creates an Authentication object.
SecurityContextHolder and ThreadLocal Isolation#
Once authenticated, Spring Security stores the Authentication object in the SecurityContextHolder. Under the hood, SecurityContextHolder uses a ThreadLocal variable to store the security context.
A ThreadLocal is a per-thread variable. Each thread has its own independent copy. When thread-47 sets a value in a ThreadLocal, thread-52 cannot read it. This is precisely what guarantees that user Alice's authentication on thread-47 is never visible on thread-52, which is serving user Bob.
After the request completes, the SecurityContextPersistenceFilter clears the security context from the thread before it returns to the pool. If this did not happen, the next request handled by the same thread would inherit the previous user's authentication — a serious security bug.
[Image Placeholder: Spring Security filter chain showing ThreadLocal security context isolation per request thread] Image Generation Prompt: "clean minimal technical diagram showing Spring Security filter chain with ThreadLocal security context isolation, two parallel request threads each having their own security context with different authenticated users, educational software architecture diagram, white background"
Async and Reactive Exceptions#
In asynchronous processing, the thread changes. When a task is submitted to a thread pool via @Async or CompletableFuture.supplyAsync(), the new thread has no security context. SecurityContextHolder.getContext().getAuthentication() returns null.
To propagate the security context across threads, wrap your runnable:
In Spring WebFlux (reactive), there is no thread-local model at all. Use ReactiveSecurityContextHolder:
Request Routing Inside Spring MVC#
DispatcherServlet#
After the filter chain completes, the request reaches DispatcherServlet. This is the central front controller in Spring MVC. There is one DispatcherServlet per application context, and every request passes through it.
DispatcherServlet does not contain any business logic. Its job is routing. It consults a list of HandlerMapping implementations to find which controller method should handle this specific request.
Handler Mappings#
The primary handler mapping for annotation-based controllers is RequestMappingHandlerMapping. During application startup, it scans all beans annotated with @Controller or @RestController and builds a map of URL patterns to method references.
When a request for GET /orders/101 arrives, RequestMappingHandlerMapping looks up this URL and HTTP method combination, finds the matching @GetMapping("/orders/{id}") method, and returns a HandlerMethod object wrapping that method reference.
DispatcherServlet then finds the appropriate HandlerAdapter (usually RequestMappingHandlerAdapter) and invokes the method. The adapter handles argument resolution (reading @PathVariable, @RequestBody, @RequestParam) and return value handling (writing the response).
Application Layer Execution#
The Layered Architecture#
Spring Boot applications typically follow a three-layer architecture: controller, service, and repository. This is not a framework requirement but a widely adopted convention that separates HTTP concerns from business logic from data access.
The controller receives the HTTP request and translates it into method calls. It should contain no business logic. The service layer contains the domain logic. The repository layer handles database interaction, typically through Spring Data JPA.
How the Call Flows Through the Layers#
From the developer's perspective, this is a straightforward method call chain. But Spring wraps each layer with proxy objects that add behavior transparently.
When your controller calls orderService.findById(id), it is not calling your OrderServiceImpl directly. It is calling a Spring-generated proxy. That proxy checks whether any AOP advice applies to this method — including @Transactional transaction management, caching interceptors, security authorization checks, and any custom aspects you may have defined.
The OrderRepository is itself a JPA repository proxy that translates the findById call into a JPQL query, manages the EntityManager, and handles the result mapping. All of this happens within the same worker thread.
Transaction Lifecycle#
How Transactions Begin#
When a method annotated with @Transactional is called through its proxy, Spring's TransactionInterceptor runs before the method body executes. It checks the transaction propagation setting (default is REQUIRED, meaning use an existing transaction or create a new one) and, if a new transaction is needed, calls the PlatformTransactionManager to begin one.
For JPA with HikariCP, beginning a transaction means: obtain a database connection from the connection pool, set autoCommit=false on that connection, and bind both the connection and the transaction status to the current thread using TransactionSynchronizationManager.
This is the key point: the transaction is thread-bound. The database connection holding the open transaction is stored in a ThreadLocal, which means it is only accessible from the thread that started the transaction.
Commit and Rollback#
After your method returns normally, the TransactionInterceptor calls commit() on the transaction. The connection flushes any pending SQL, commits the transaction on the database, sets autoCommit=true, and returns the connection to the pool.
If your method throws an unchecked exception (a RuntimeException or Error), the interceptor calls rollback() instead. The in-progress transaction is rolled back on the database, and the connection is returned to the pool.
Async and Reactive Exceptions#
Transactions are bound to the current thread via ThreadLocal. If the thread changes mid-transaction — which happens with @Async, CompletableFuture, or reactive pipelines — the new thread has no transaction context. Any JPA operations on the new thread will either start a new transaction or run without one, depending on propagation settings.
There is no clean way to continue a JDBC transaction across thread boundaries. The recommended pattern is to complete all transactional work on a single thread, then hand off non-transactional work asynchronously.
For reactive applications, Spring provides ReactiveTransactionManager and @Transactional support in WebFlux, but this operates on a Reactor context rather than ThreadLocal, and requires reactive-compatible database drivers (R2DBC, not JDBC).
Database Connection Pool Usage#
How the Pool Works#
Spring Boot auto-configures HikariCP as the default connection pool. On startup, HikariCP creates a pool of physical JDBC connections to your database server. By default, maximumPoolSize is 10.
When a transaction begins (as described above), the TransactionInterceptor asks HikariCP for a connection. HikariCP checks if any connections are idle in the pool. If one is available, it marks it as borrowed and returns it. If none are available, the calling thread waits up to connectionTimeout milliseconds (default 30 seconds) for a connection to become free.
The Connection Is Held for the Transaction Duration#
A connection is held for the entire duration of the transaction. If your transaction opens at the start of a service method and does not commit until the end, the connection is tied up for that entire period — including any time spent doing computation, calling external services, or executing slow queries.
This is the second hard throughput ceiling: with maximumPoolSize=10, only 10 transactions can hold active database connections at any given moment. Thread 11 through 200 will be blocked waiting for a connection if the first 10 threads are all in active transactions.
Pool Exhaustion#
When the connection pool is exhausted and no connection becomes free within connectionTimeout, HikariCP throws a SQLTransientConnectionException. This surfaces in your application as a 500 error.
The common mistake here is setting maximumPoolSize too high. More connections do not mean more throughput; they mean more concurrency on the database, which eventually saturates database CPU. The right pool size depends on your database server's capacity and your query patterns.
Response Generation#
Returning from the Controller#
Once the service method returns its result, control flows back through the proxy layers (any @AfterReturning advice, transaction commit) and eventually back to DispatcherServlet, which now has the return value from the controller method.
For @RestController methods, the return value needs to be serialized to an HTTP response body. DispatcherServlet hands this off to a HandlerMethodReturnValueHandler, which for ResponseEntity or plain objects, delegates to an HttpMessageConverter.
Jackson and JSON Serialization#
Spring Boot auto-configures Jackson's MappingJackson2HttpMessageConverter. When the content negotiation process determines that the client expects application/json (typically from the Accept header or by default), Jackson is used to serialize the return object.
Jackson uses reflection to inspect the object's fields, calls getter methods, and writes a JSON string to the HttpServletResponse's output stream.
The response is then flushed over the TCP connection back to the client, and the worker thread is released back to Tomcat's thread pool.
System Limits and Throughput#
The Three Hard Limits#
Every Spring Boot application operating under the thread-per-request model has three fundamental throughput ceilings:
The first is the thread pool size. With a default of 200 threads, you can process at most 200 requests concurrently. If each request takes 100ms on average, your theoretical maximum throughput is around 2000 requests per second — and in practice, it will be lower due to overhead.
The second is the database connection pool size. With a default of 10 connections, at most 10 requests can be in an active transaction simultaneously. If your average transaction time is 20ms, that is 500 transactional operations per second before threads start queuing for connections.
The third is the database server itself — its CPU, memory, I/O, and the complexity of your queries. The connection pool is a client-side throttle that protects the database. If you bypass it by increasing pool size too aggressively, you transfer the bottleneck to the database server instead.
Throughput Formula#
Effective throughput depends on request latency. If average request duration is L milliseconds and you have T threads, your maximum throughput is approximately T / L * 1000 requests per second.
A 50ms average request latency with 200 threads gives roughly 4000 req/sec theoretical maximum — but that only holds if no other bottleneck intervenes, which in practice, the database connection pool usually does first.
Bottlenecks and Failure Scenarios#
Thread Exhaustion#
Thread exhaustion occurs when all 200 worker threads are occupied and the TCP accept queue is also full. New clients receive connection refused errors. Existing requests in the accept queue receive connection timeout errors after waiting.
The most common cause is not raw traffic volume — it is slow requests. If your application normally handles requests in 50ms but a downstream service starts responding in 5 seconds, threads start piling up. With 200 threads and a 5-second average duration, the system saturates at just 40 requests per second instead of 4000.
Symptoms include rising response time metrics, thread pool exhaustion alerts, and eventually connection refused errors from the load balancer.
The solution is a combination of: timeouts on external calls, circuit breakers, and either horizontal scaling or moving to a reactive model for I/O-heavy workloads.
Connection Pool Exhaustion#
Connection pool exhaustion happens when all 10 (or however many you configured) database connections are held and no new one becomes available within connectionTimeout. Threads that need a connection block, which accelerates thread exhaustion.
The common triggers are: slow database queries holding connections longer than usual, unexpectedly high traffic, a transaction that holds a connection open across a remote API call (a very common mistake), or a connection leak where connections are borrowed but never returned.
The fix is to restructure so that the remote call happens outside the transaction, and the transaction only wraps the actual database operations.
Request Timeouts#
If Tomcat has no explicit request timeout configured and a slow request holds a thread for minutes, it simply occupies that thread for the full duration. You can set a read timeout:
At the application level, setting timeouts on RestTemplate, WebClient, and database query execution limits prevents single slow operations from consuming thread resources indefinitely.
Final Visualization — Complete Request Lifecycle#
The diagram below ties together every stage described in this article. Following the full path of a single request reveals how each component depends on the one before it, and why bottlenecks in one layer cascade into failures across the rest.
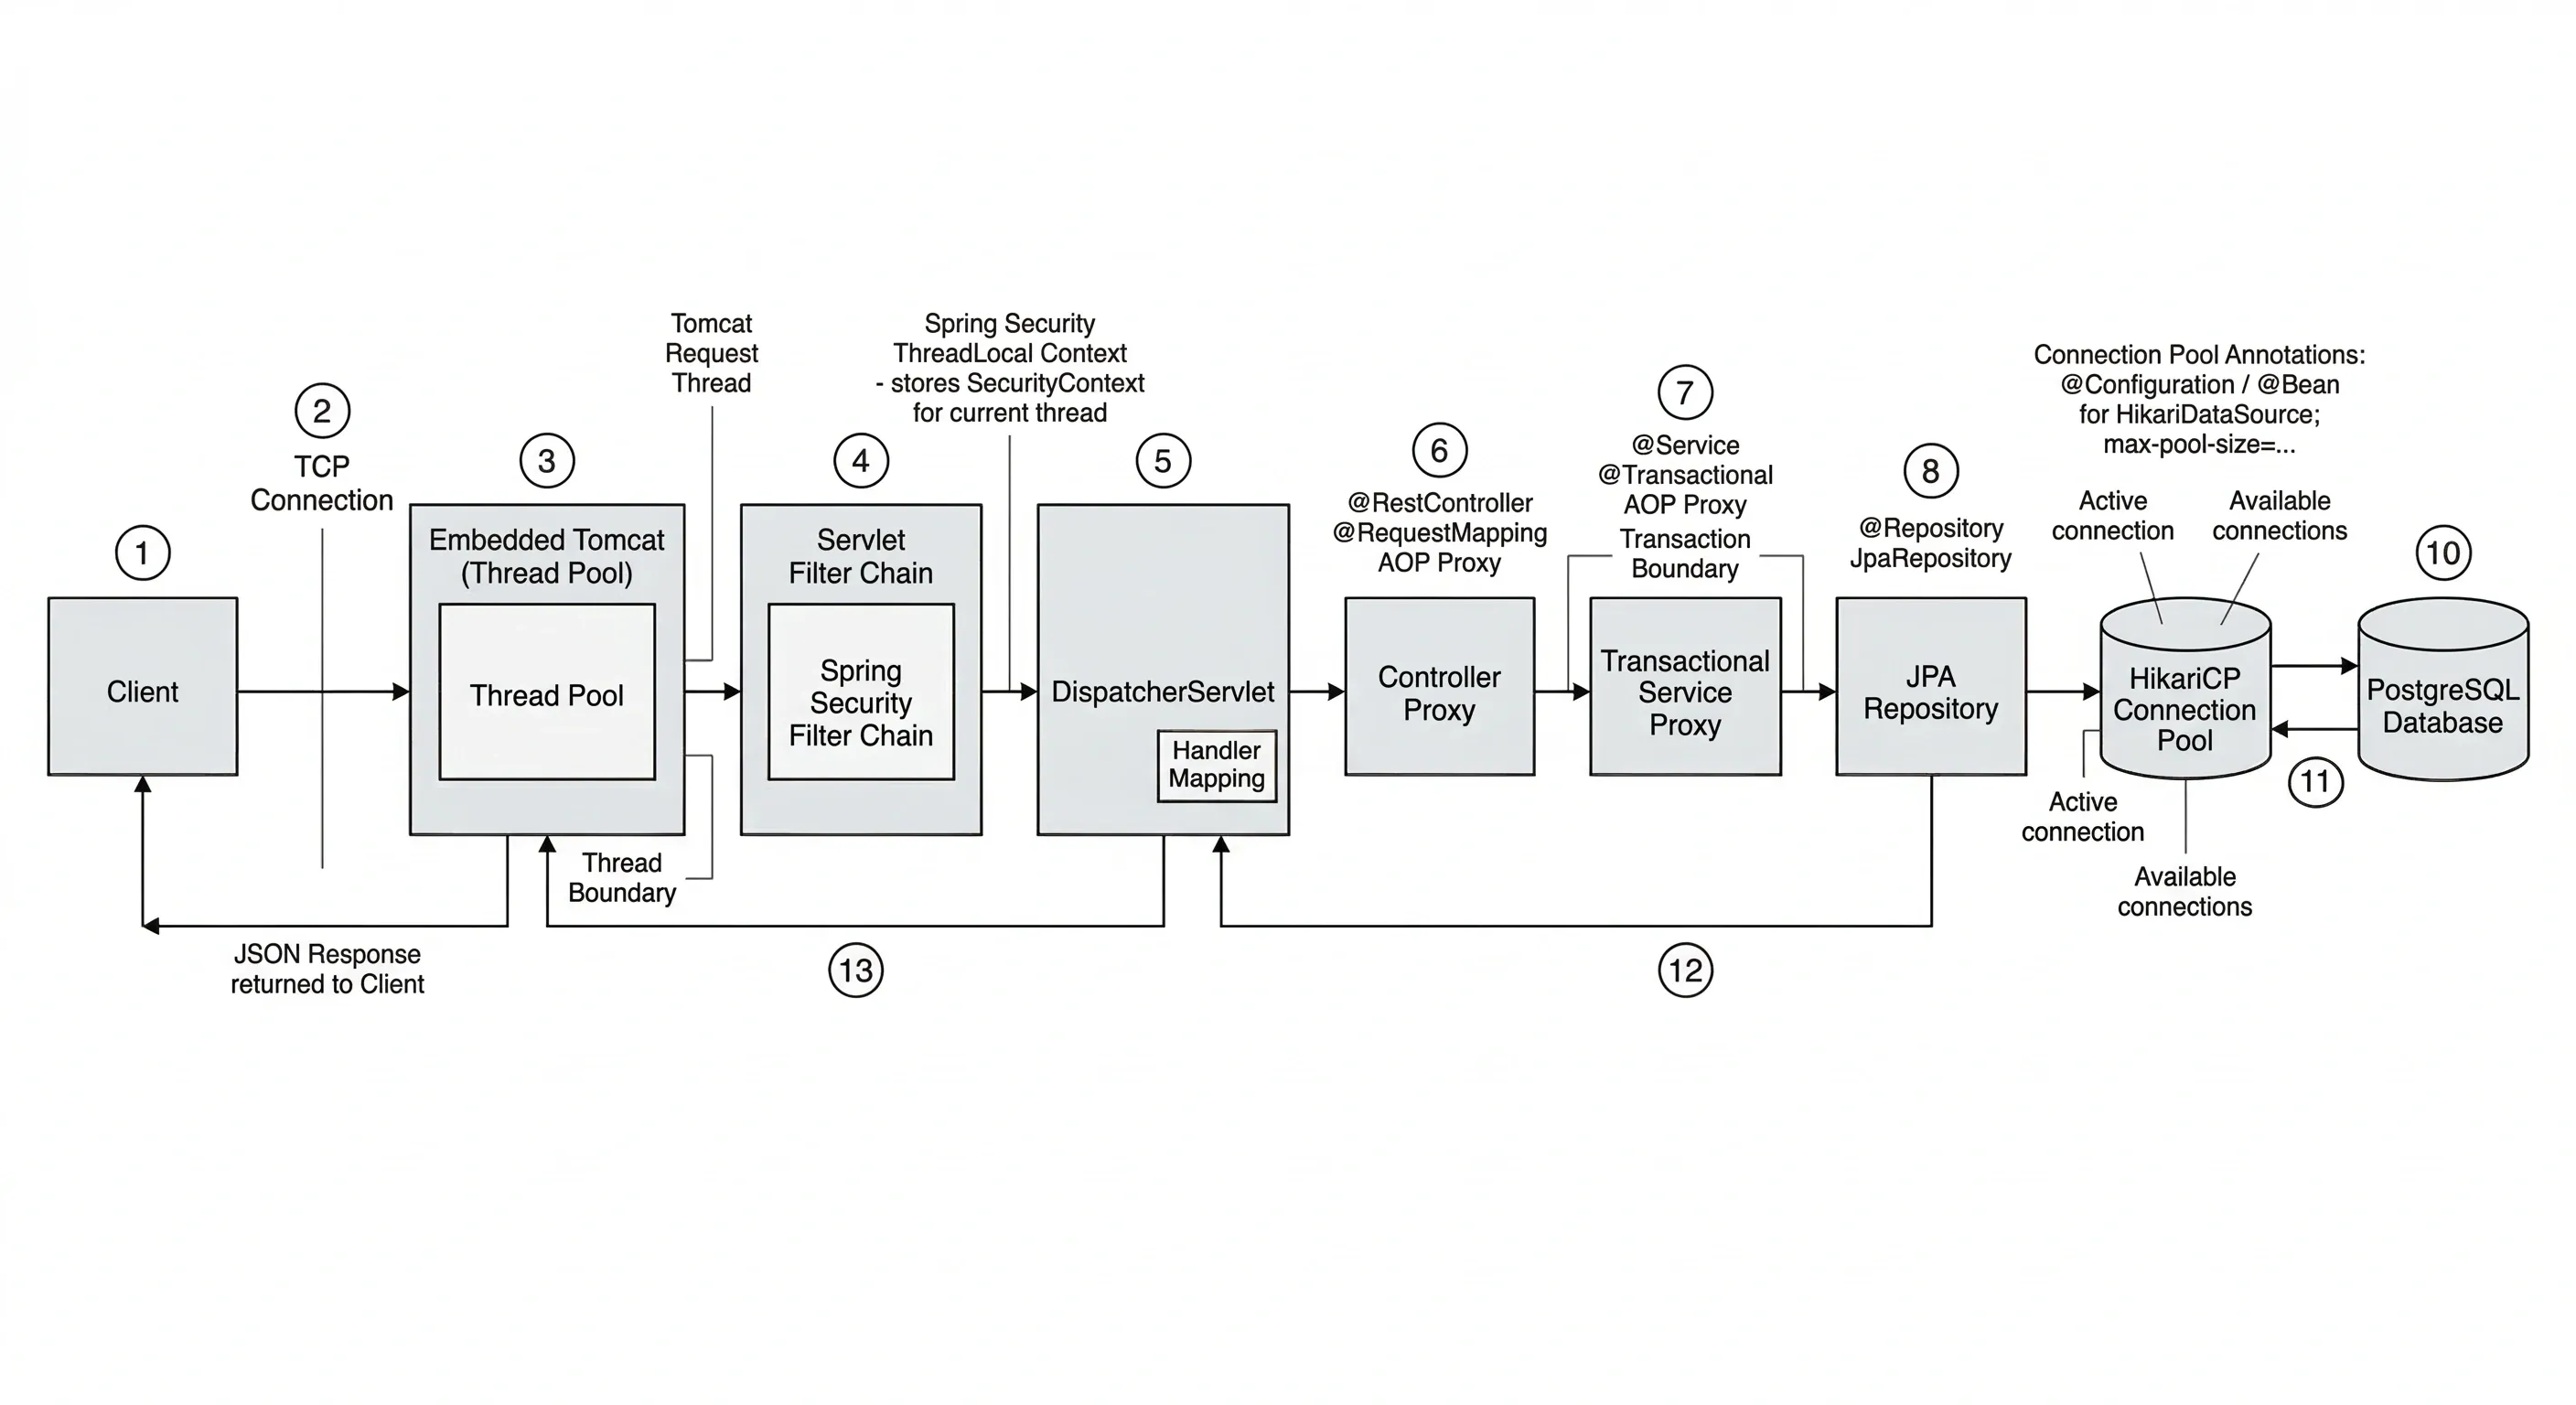
The sequence for a single request, fully detailed:
Step 1 — TCP Acceptance. The client opens a TCP connection. Tomcat's acceptor thread receives it and places it in the worker queue.
Step 2 — Thread Assignment. A worker thread from the thread pool picks up the request. This thread will carry the request from this point until the response is written.
Step 3 — Filter Chain. The request traverses the filter chain. Spring Security filters extract the JWT or session token, validate it, create an Authentication object, and store it in the SecurityContextHolder ThreadLocal on this thread.
Step 4 — DispatcherServlet Routing. DispatcherServlet consults RequestMappingHandlerMapping, finds the target controller method, and invokes it via RequestMappingHandlerAdapter.
Step 5 — Controller Proxy. The controller calls the service through a Spring AOP proxy. The proxy evaluates any applicable aspects before delegating to the actual service method.
Step 6 — Transaction Begins. The @Transactional proxy intercepts the service method call. TransactionInterceptor asks HikariCP for a connection. HikariCP lends one from the pool. The connection is bound to the current thread via TransactionSynchronizationManager.
Step 7 — Repository and Query Execution. The repository proxy translates the method call into SQL via JPA/Hibernate. The SQL is executed on the borrowed connection. Results are mapped to entity objects.
Step 8 — Transaction Commits. Control returns to the @Transactional proxy. No exception was thrown, so the transaction is committed. The connection is returned to HikariCP's pool.
Step 9 — Response Serialization. The controller returns a response object. Jackson serializes it to JSON and writes it to the HttpServletResponse output buffer.
Step 10 — Security Context Cleared. Spring Security's SecurityContextPersistenceFilter clears the ThreadLocal context, ensuring no user data leaks to the next request.
Step 11 — Thread Released. The response is flushed over TCP. The worker thread is returned to Tomcat's thread pool, ready for the next request.
Conclusion#
Understanding the internal lifecycle of a Spring Boot request is not just academic—it provides a mental model that helps you reason about performance, debug production issues, and make confident architectural decisions.
The thread-per-request model in Spring MVC ensures that every layer of your application executes on the same OS thread. This thread carries all state: security context, transaction bindings, and borrowed database connections. Any break in that continuity—through async execution, reactive pipelines, or additional thread pools—requires explicit management of this state.
Your application's throughput ceiling isn’t determined by your code alone. It’s defined by three key numbers: threads.max, maximum-pool-size, and average request latency. Measure these under realistic load and tune them for your actual workload instead of relying on defaults.
When traffic spikes, failures follow a predictable cascade: slow requests fill threads, threads waiting for connections queue up, the connection pool exhausts, and clients see 500 errors. Understanding this pattern allows you to detect issues early and respond before a full outage occurs.
If you find this guide useful, share it with your friends!
Want to Master Spring Boot and Land Your Dream Job?
Struggling with coding interviews? Learn Data Structures & Algorithms (DSA) with our expert-led course. Build strong problem-solving skills, write optimized code, and crack top tech interviews with ease
Learn more

